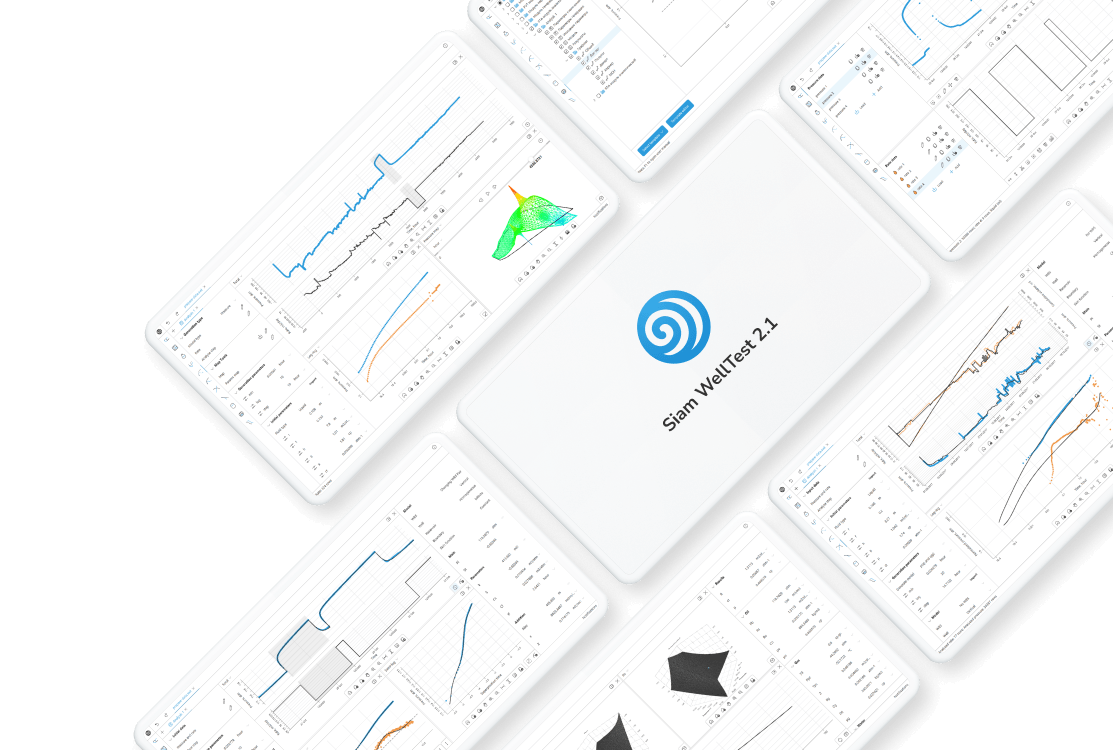
Siam Geotest presents an update to the SiamWellTest 2.1.0 software suite. The new release significantly expands the product's applicability by introducing numerical simulation tools for solving hydrodynamic analysis tasks.
1. Numerical Simulator Integration
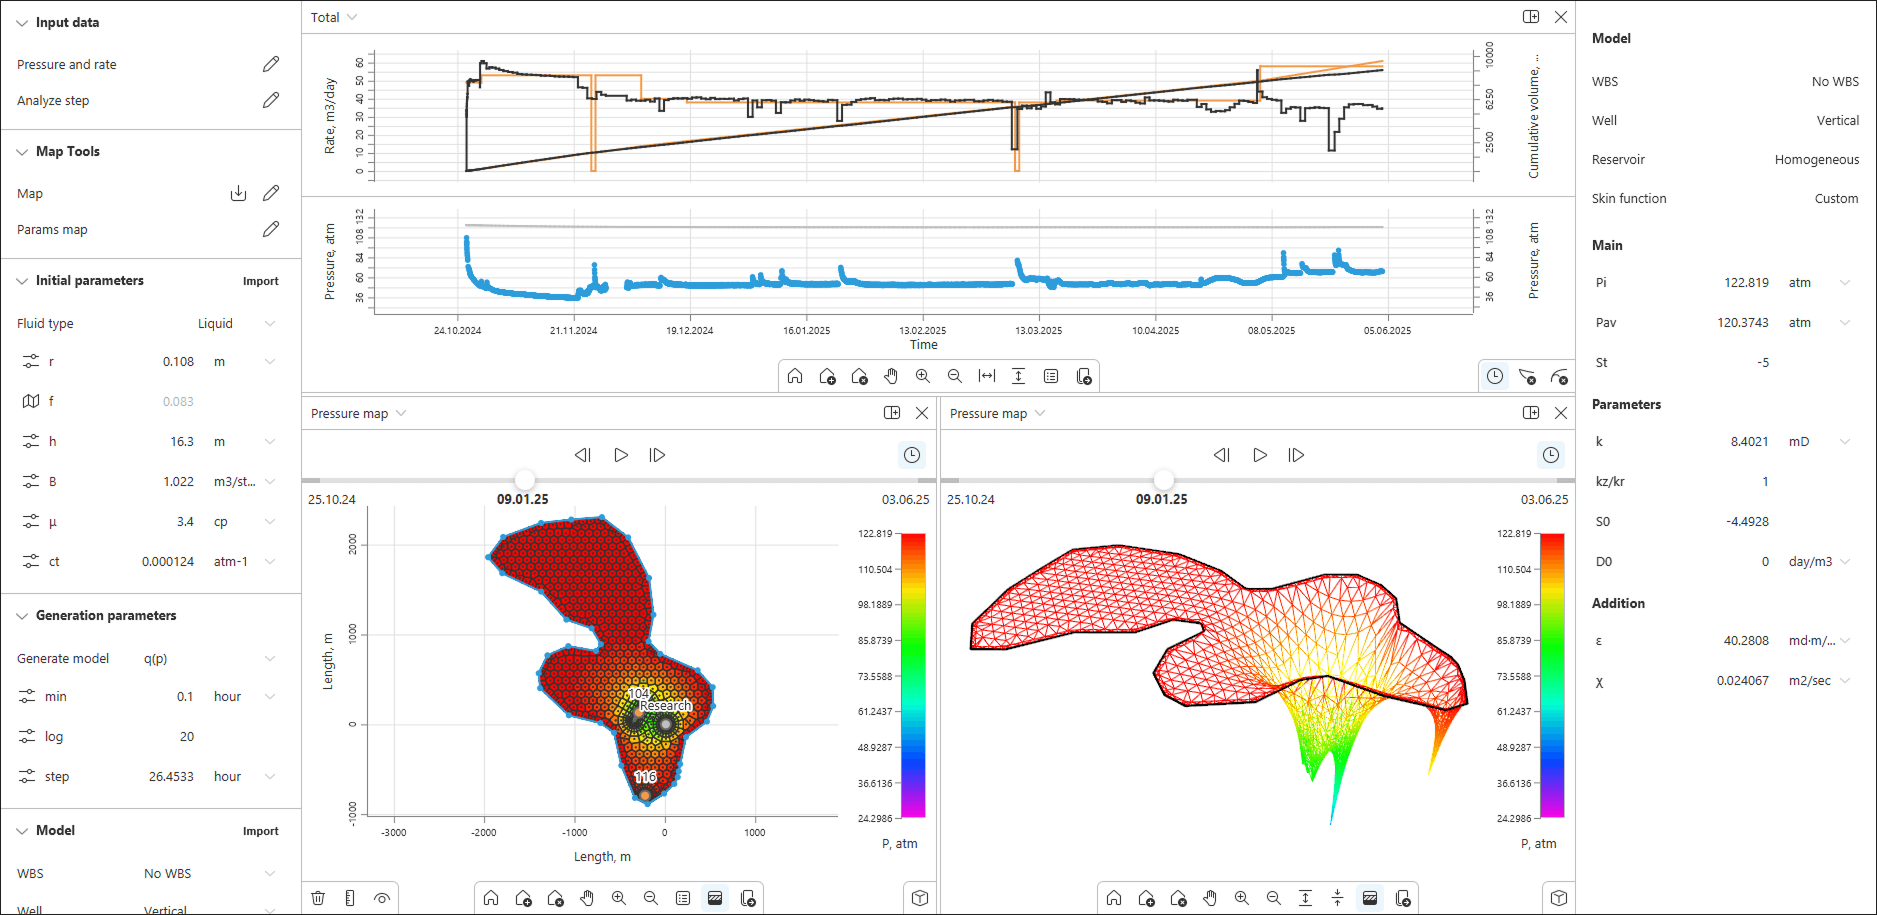
The PTA (Pressure Transient Analysis), RTA (Rate Transient Analysis), and pressure/rate generation modules have been enhanced with numerical flow simulation capabilities. This allows for detailed consideration of reservoir geometry and spatial heterogeneity of properties.
Features of the numerical approach implementation:
- Detailed geometry handling: modeling of objects with arbitrary boundary shapes, internal faults, and spatial heterogeneity of reservoir properties (porosity/permeability).
- Performance and efficiency: high calculation speed achieved through adaptive grid generation algorithms and modern fast solvers.
- Solution verification: demonstrated high convergence of simulation results with both known analytical solutions and benchmark solutions from recognized numerical simulators.
2. Map Module Functional Development
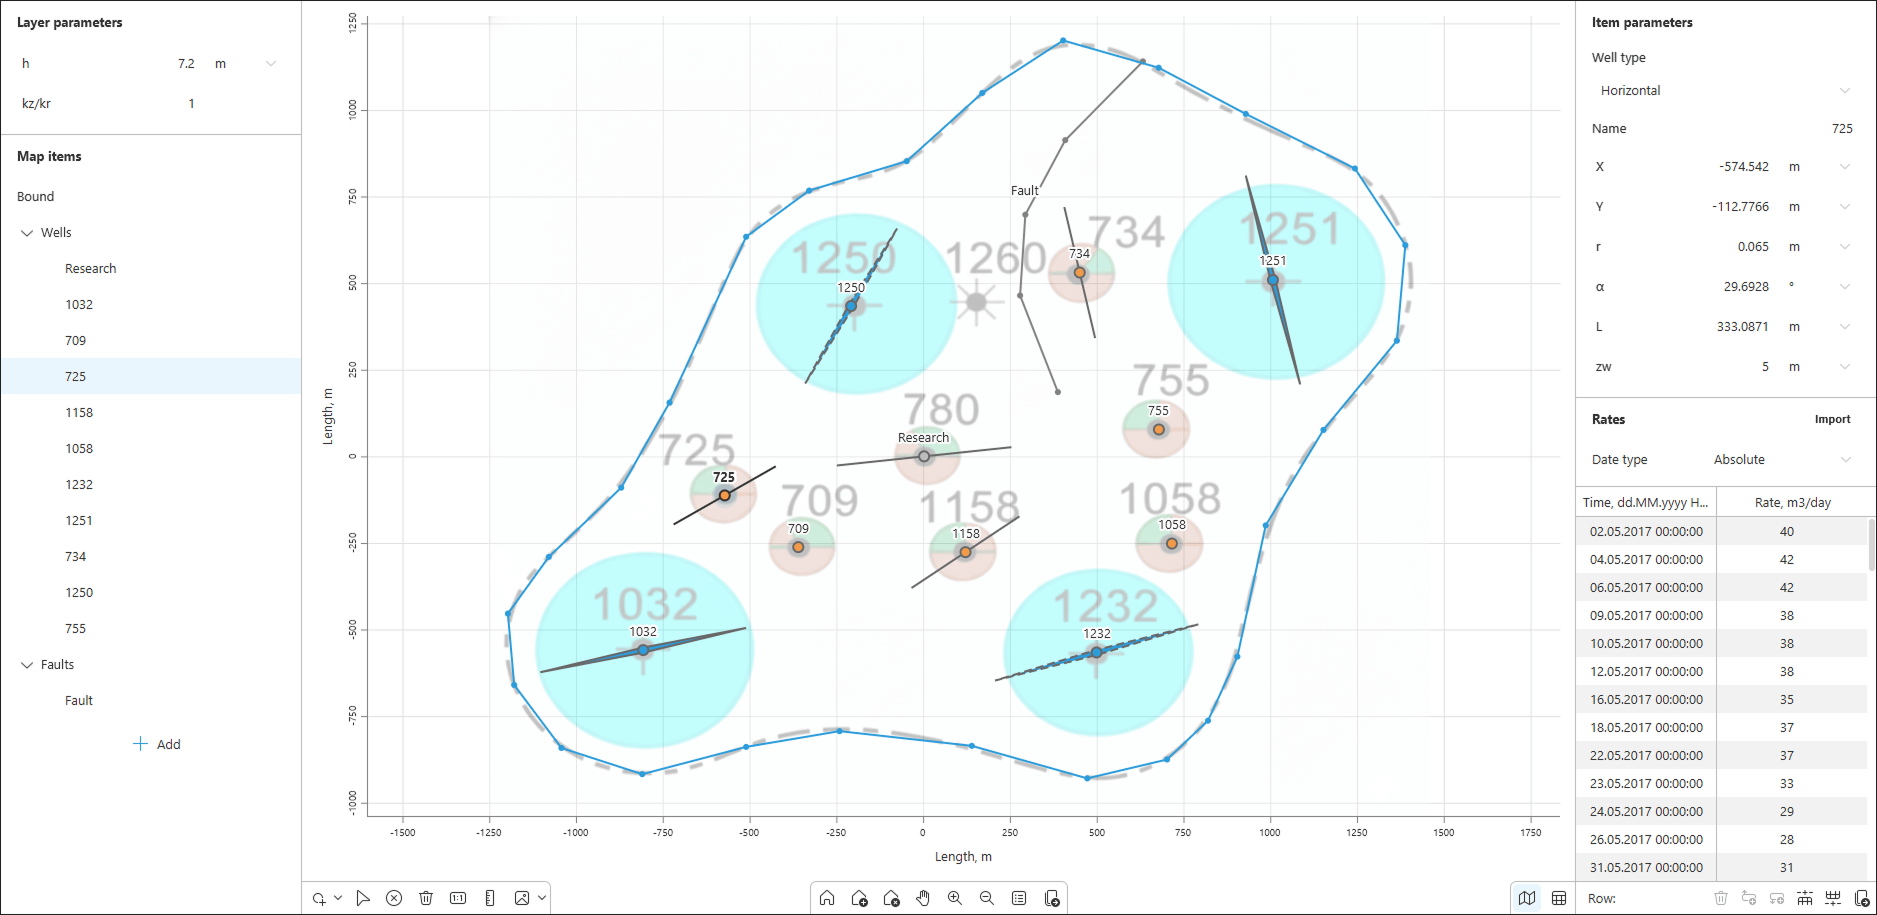
The Map module has been transformed into an interactive editor for constructing simulation schemes, which serve as the foundation for generating numerical simulation grids.
- New objects: functionality has been added to place faults, reservoir boundaries, and wells with common completion types and wellbore trajectories on the scheme.
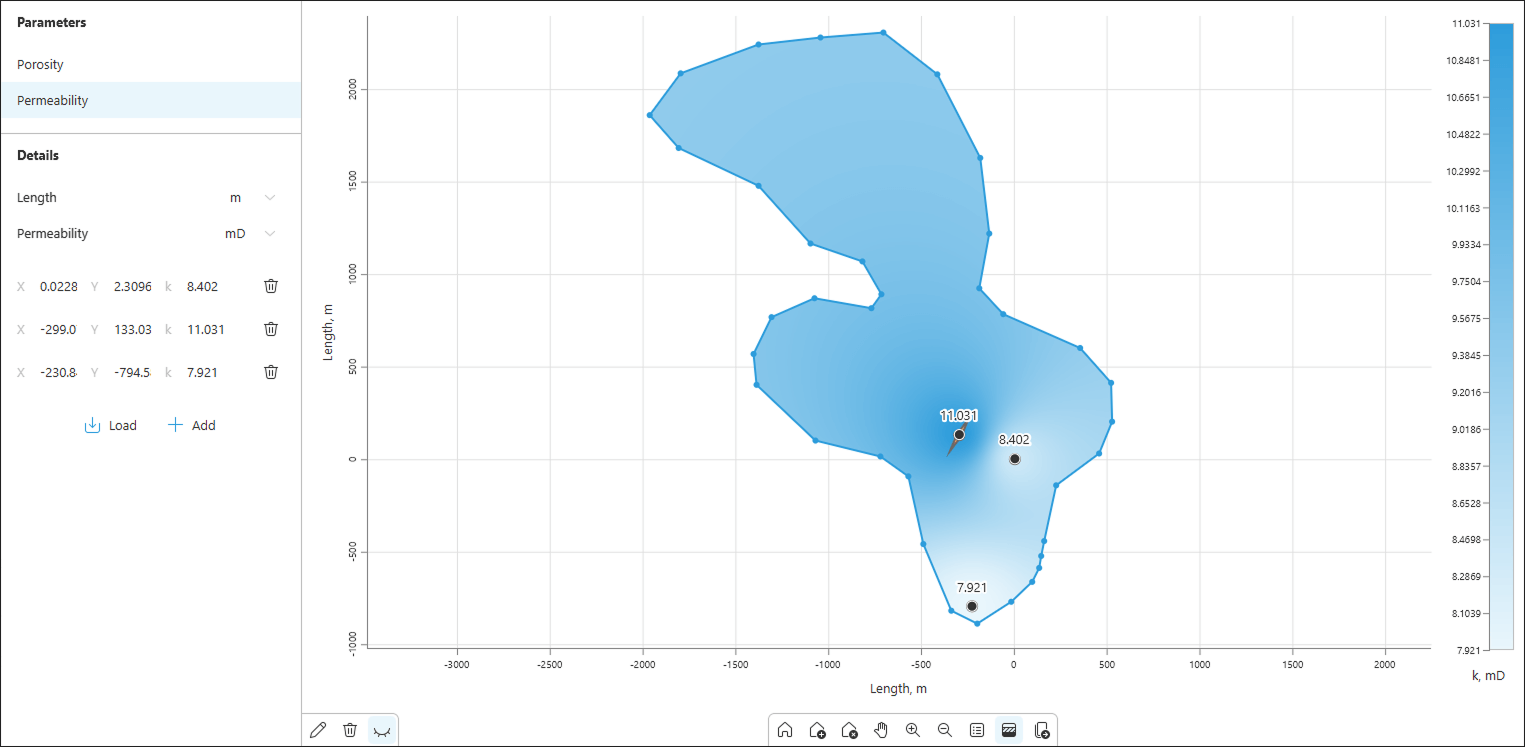
- Parameterization: a system for defining physical properties for each scheme element has been implemented, along with input fields for general parameters of the modeled reservoir.
- Interface and navigation: a redesigned toolbar structure makes the scheme construction process faster and more intuitive.
3. New Comparison Module
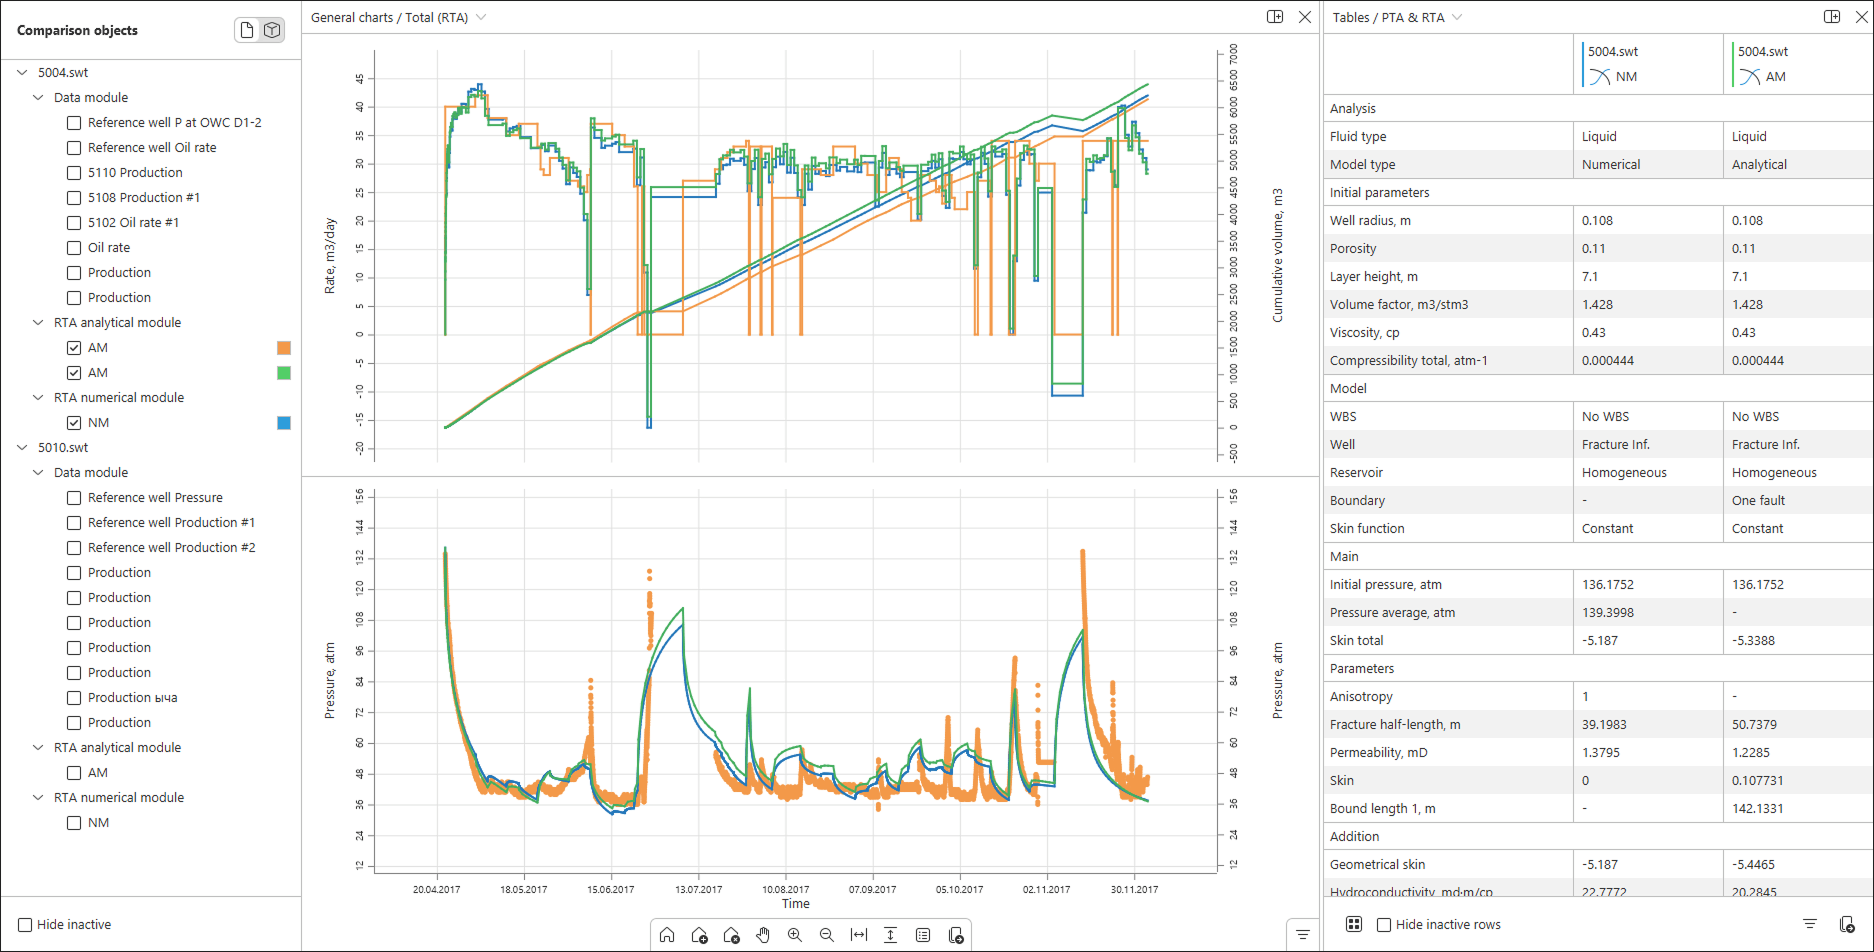
The suite now includes a Comparison module for rapid comparison of data from different parts of the project.
- Versatility: the tool allows comparison of any tabular and graphical project data, including raw measurements, PVT analysis results, and final interpretation models.
- Visualization: supports data comparison in both graphical and tabular views.
- Dynamic updates: the module operates in real time, instantly reflecting any changes to data or scenarios within the project.
Fixes and Improvements
Application
- Expanded the set of supported units of measurement for indicator diagrams
- Fixed localization and interface translation errors
- Added support for various tab types within a single module, allowing analytical and numerical analyses to run in a unified workspace
- Improved the display of plots with two Y-axes
- Increased application stability when closing windows and during session termination
- Updated and actualized the user manual
PTA, RTA, and Generation modules
- Added the WBS (Wellbore Storage) model by Hegeman
- Added a "Ruler" tool to the "Map" plot toolbar
- Improved the functionality of the Skin Factor vs. Rate plot
- Improved interface behavior when working with different fluid types
- Analysis tabs now feature visual indicators to easily distinguish between analysis types
- Improved logic for saving and managing tabs
- Improved logic for calculating absolute time in the Generation module when modeling flow rates
- Improved the "Undo" function when working with boundaries in analytical modules
Pressure recalculation module
- Improved inclinometry loading logic for deviated and horizontal wells
- Increased stability of pressure calculations using the Hasan-Kabir method
PVT module
- Improved the saturation input interface
- Fixed an error in applying gas composition module parameters
Reporting module
- Expanded report content to include results from numerical modules (PTA, RTA, Generation), including pressure maps, heat maps, and average reservoir pressure plots
Import and export
- Implemented cross-module data import between analytical and numerical modules
- Debugged import of files from the first-generation application format (.shf)
- Added import for numerical models in .ks5 / .kt5
- Improved stability and completeness of data import from .ks5 / .kt5 files