What Auto-HF Is and Its Features
During injection well operation, a phenomenon known as AHF is often encountered — the auto hydraulic-fracture of a formation caused by high pressure of fluid injection. The resulting fractures have variable geometry, where the half-length directly depends on the pressure at the bottom of the well. Without taking this fact into account when interpreting the PTA, a number of mistakes can be made.
Characteristic Data Pattern When Testing a Well with Auto-HF
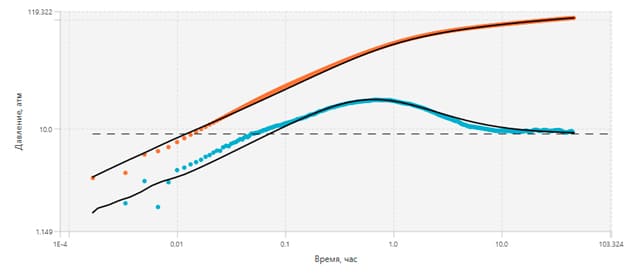
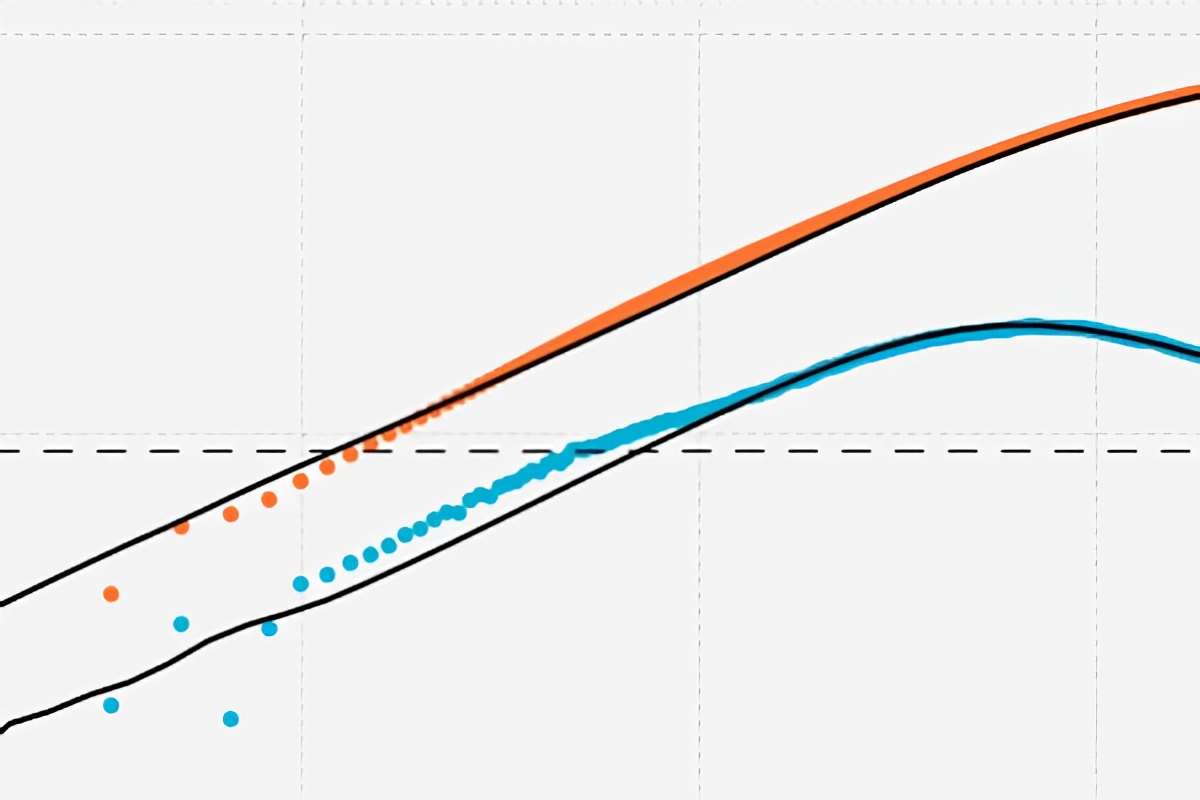
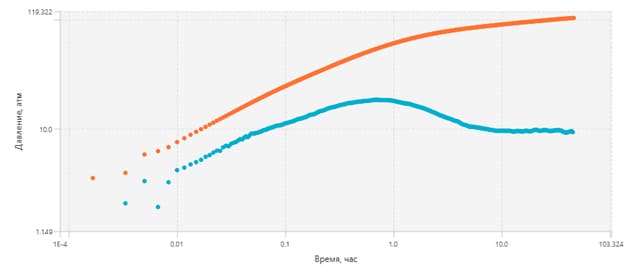
When testing such a well on the pressure derivative, the effect of transition from one geometry to another can be observed. A typical view of data from a well with auto hydraulic-fracture is shown in the figure below:
The Challenge of Choosing a Time Interval for Model Fitting
You can see classical linear flow at short times and stabilized radial flow at long times. There is a transition effect between them which does not correspond to the mathematical model of the fracture. If you try to match a model in the standard way, the question arises: which period of time should you focus on when adapting the model — the initial or the final one?
Fitting to Late Times: Limitations of the Approach
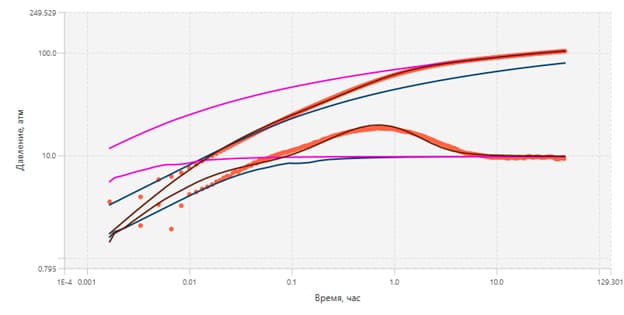
Trying to adapt the model to long times (purple lines) with a constant radial flow position leads to a mismatch on short times. Usually this discrepancy is balanced by interpreters using a changing WBS (black curves). In this approach, the obtained value of the half-length remains equal to the number corresponding to the half-length of the fracture in its closed state. Using such a value in subsequent hydrodynamic calculations is incorrect, since the fracture increases in size during well operation.
Fitting to Early Times: A Partial Solution
It is possible to partially estimate the size of the fracture while the well is operating in linear flow mode, adapting the model for short times (blue curves). In this case, the size of the fracture for a particular mode is estimated, but the model will not match the remaining data areas.
The Solution from the SiamWellTest Team
Since this phenomenon is quite common in the injection well stock, it would be advisable to have a tool which can provide correct characteristics of the system under study. The SiamWellTest team made an attempt to develop such a tool, simulating the process of changing fracture geometry mathematically. As a result, a fairly good convergence with the actual data was achieved.