
SiamDataSpectrum
A platform for storing and analyzing time-series data. A single source of truth for all industrial telemetry.
10+ years
the entire well history in a single archive
1 billion+ points
on a chart at any zoom level, with no lag when zooming or panning
1,000+ objects
wells, gauges, facilities; millions of measurements without performance loss
up to 1M points/sec
peak data ingestion rate during bulk loading
Application
Tasks the product solves
Large telemetry archives, instant access to any interval — at the resolution you need, without switching between tools
Problem
Solution
Data is scattered across files, formats, and applications
A single repository with centralized access
Standard tools can't handle large volumes
A specialized architecture — instant visualization of any interval
Risk of data loss, no access control
Role-based model, integrity control, SSL/TLS protection
Advantages
Key capabilities
Original files and processed data are stored side by side, for decades, with regular backups. Millions of measurements — in one place, with fast access.
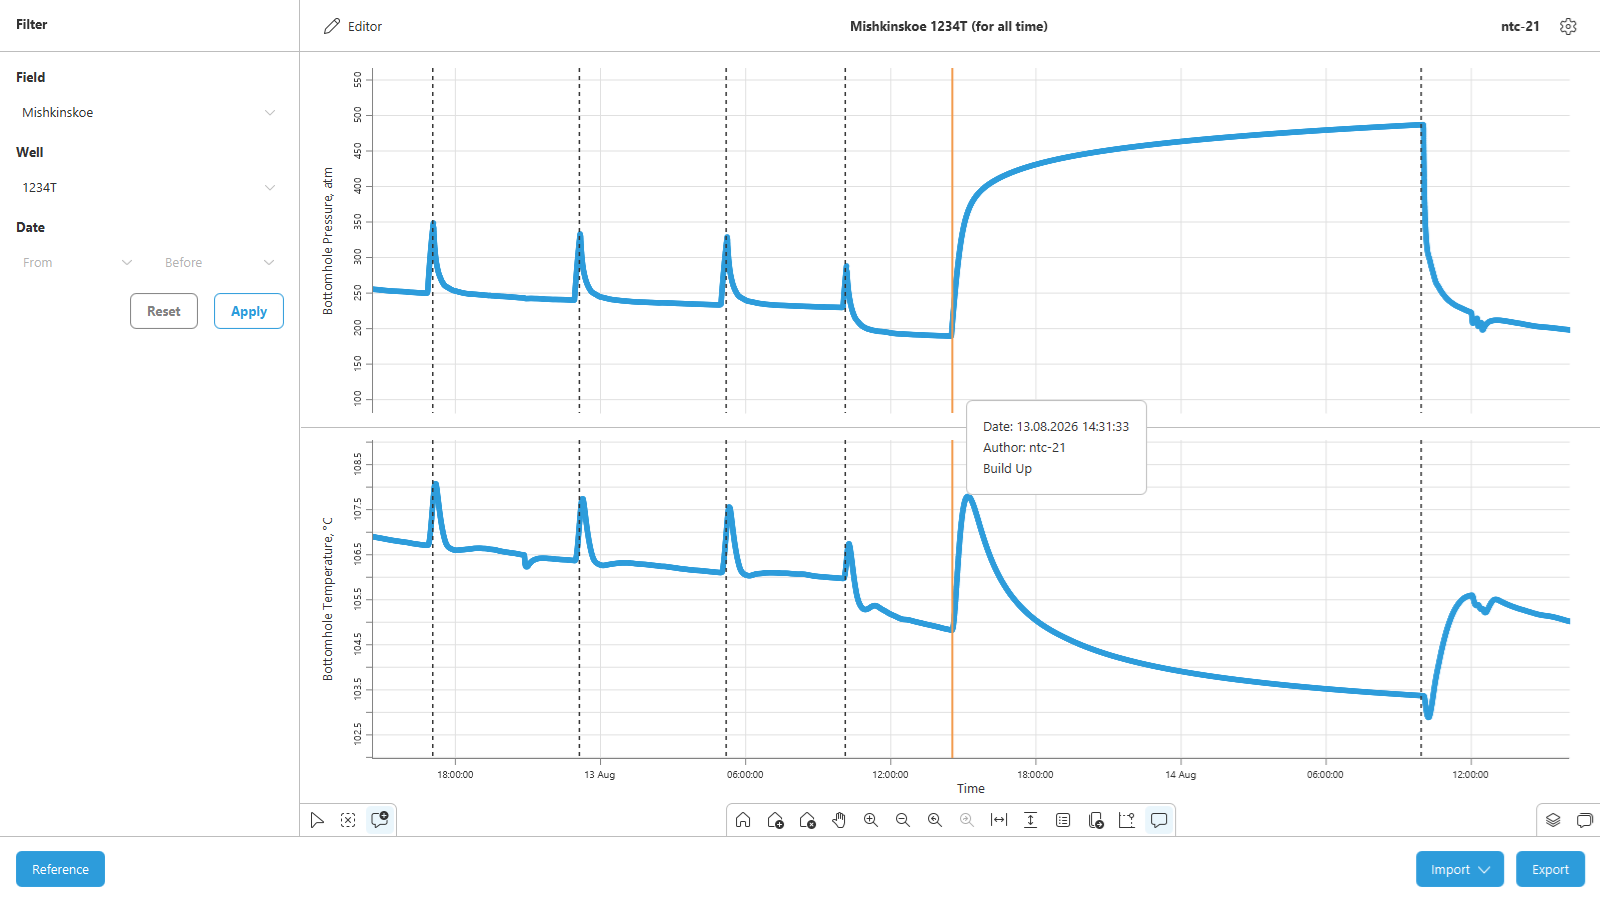
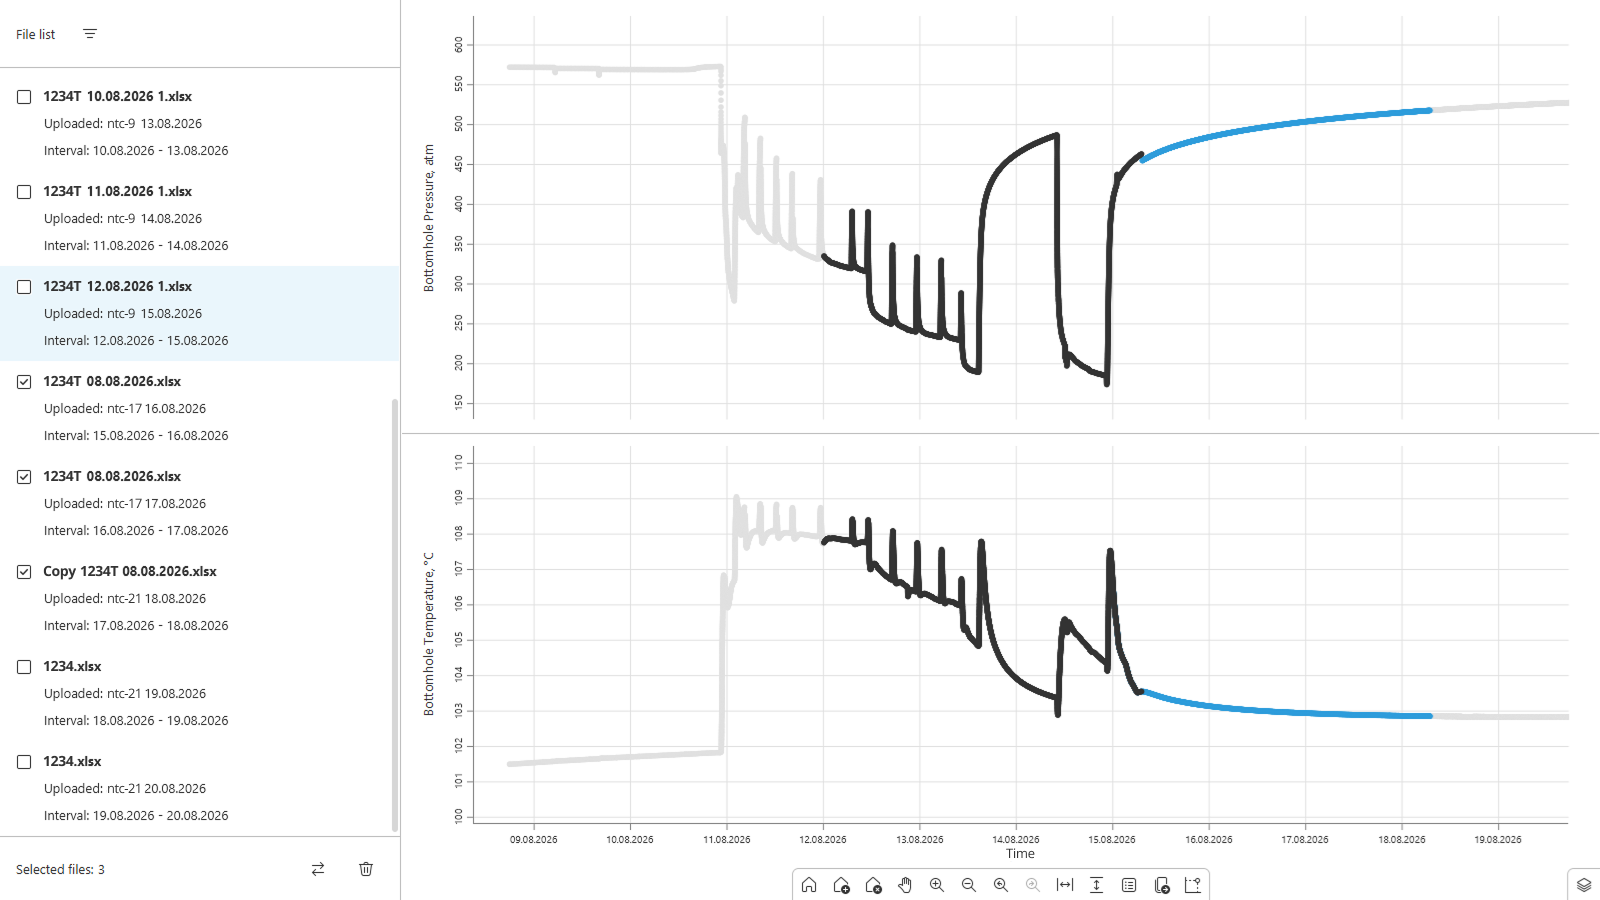
Charts with billions of points open instantly at any zoom level, with no data loss.
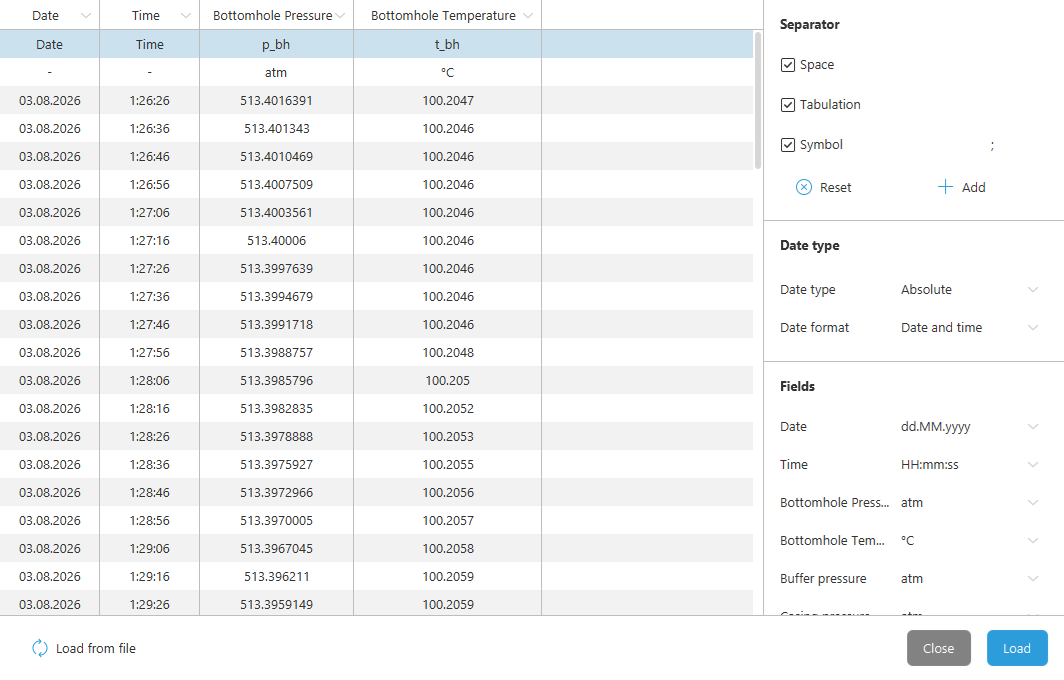
Text and tabular files, clipboard, SIAM device binary formats (DAT, DBF), batch and consolidated import. Flexible loaders accept data from any source.
MPa or atm, °C or °F — switch on the fly during import, export, on charts, and in input fields. Convenient defaults are set in settings.
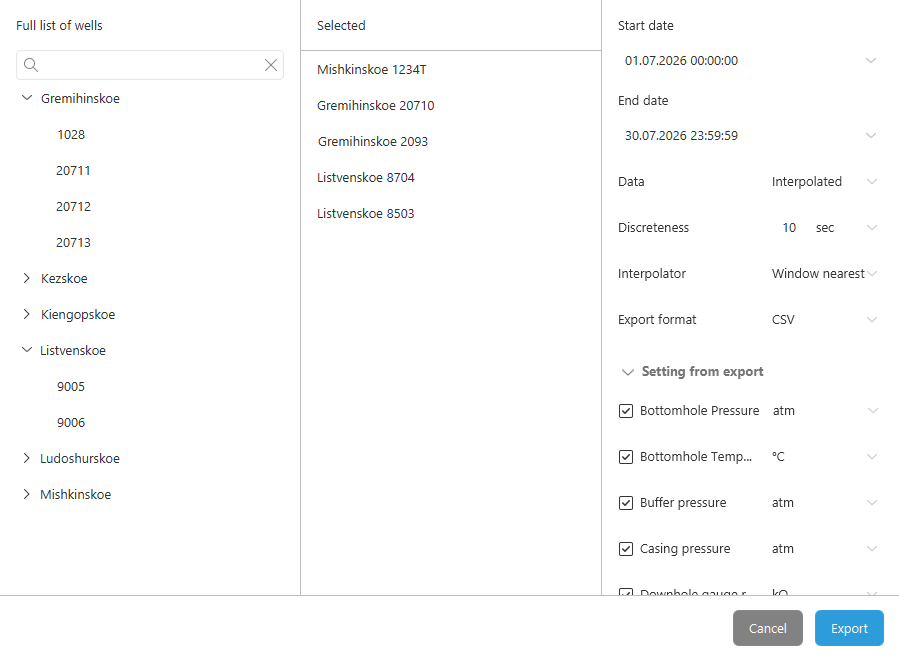
Export data in its original form or with thinning algorithms applied. A built-in interpolation system lets you synchronize heterogeneous time series onto a common time grid.
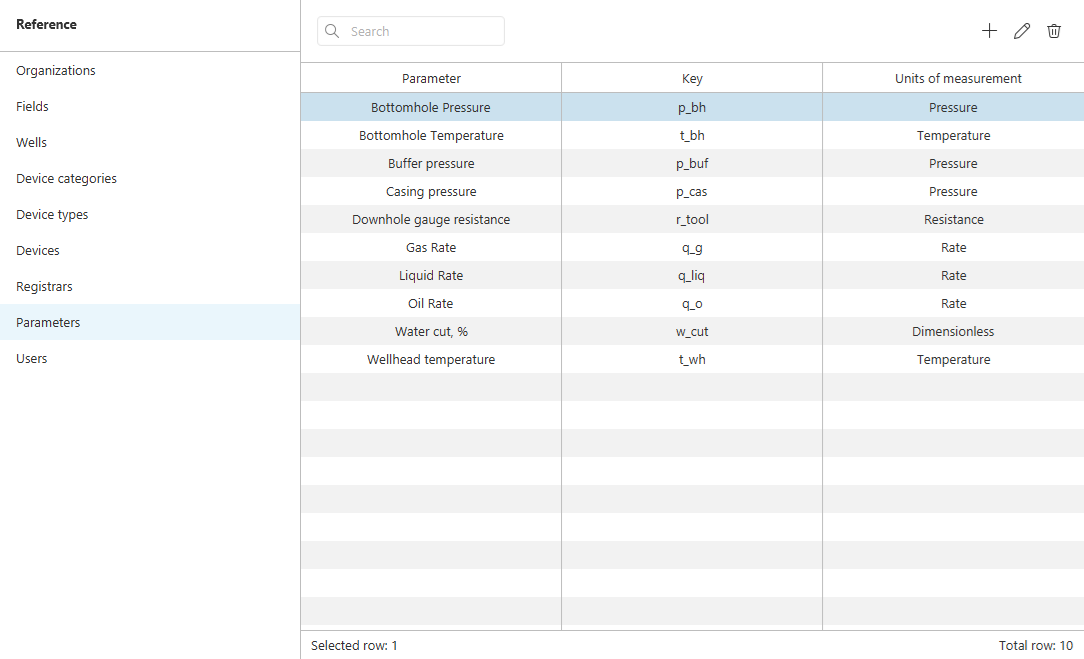
Series types aren't hardcoded into the system: the administrator adds new ones — pressure, temperature, engine RPM, and others. The platform adapts to any telemetry.
A role-based model separates user permissions: viewing, uploading, editing, managing reference data. Data transfer is protected by SSL/TLS.
Storage architecture
The data path from file to chart
Data is sequentially transformed into a form optimized for reading — from the source file to a ready-made chart segment.
Original files
Stored as-is — for auditing and reprocessing.
Measurements
A source file tagged for the system: linked to a well and series.
Packs
Immutable daily blocks — the atomic building block of a measurement.
Timelines
A daily slice of a series, where data from all measurements is merged into one block.
Segments
Series aggregates at various resolutions — for instant chart rendering.
The system picks the segment with the right resolution — coarse for a long interval, more detailed as you zoom in. Response speed doesn't depend on the volume of accumulated data.
Lifecycle
Measurement management
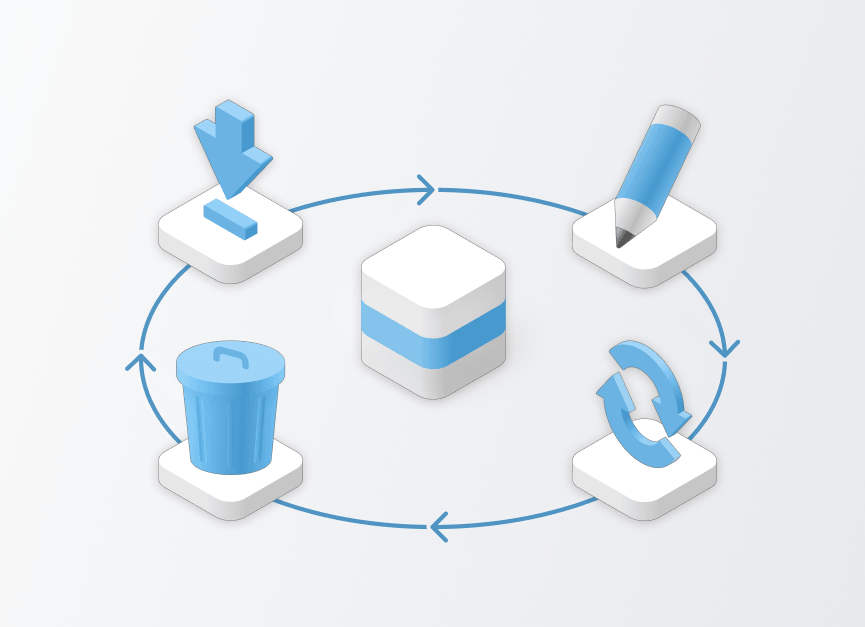
A measurement is the key data management unit in the system. Four operations fully cover its lifecycle.
Upload
Creating a new measurement from a file
Update
Editing data of an existing measurement
Delete
Removing a measurement from the system
Reassignment
Moving a measurement to another well while preserving its change history
Interface
Application graphical interface
Deployment
System deployment options
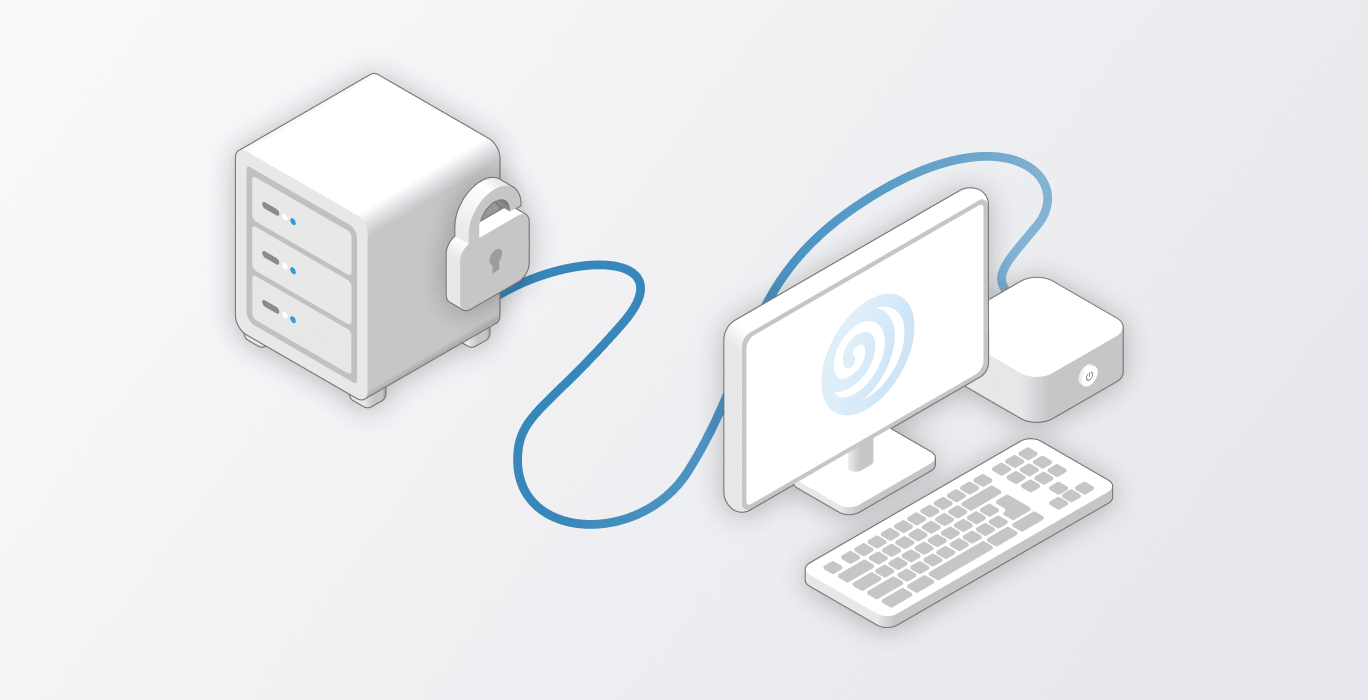
Local installation (On-Premise)
Server and client software is installed on the customer's infrastructure (local servers, private cloud). Full control over data.
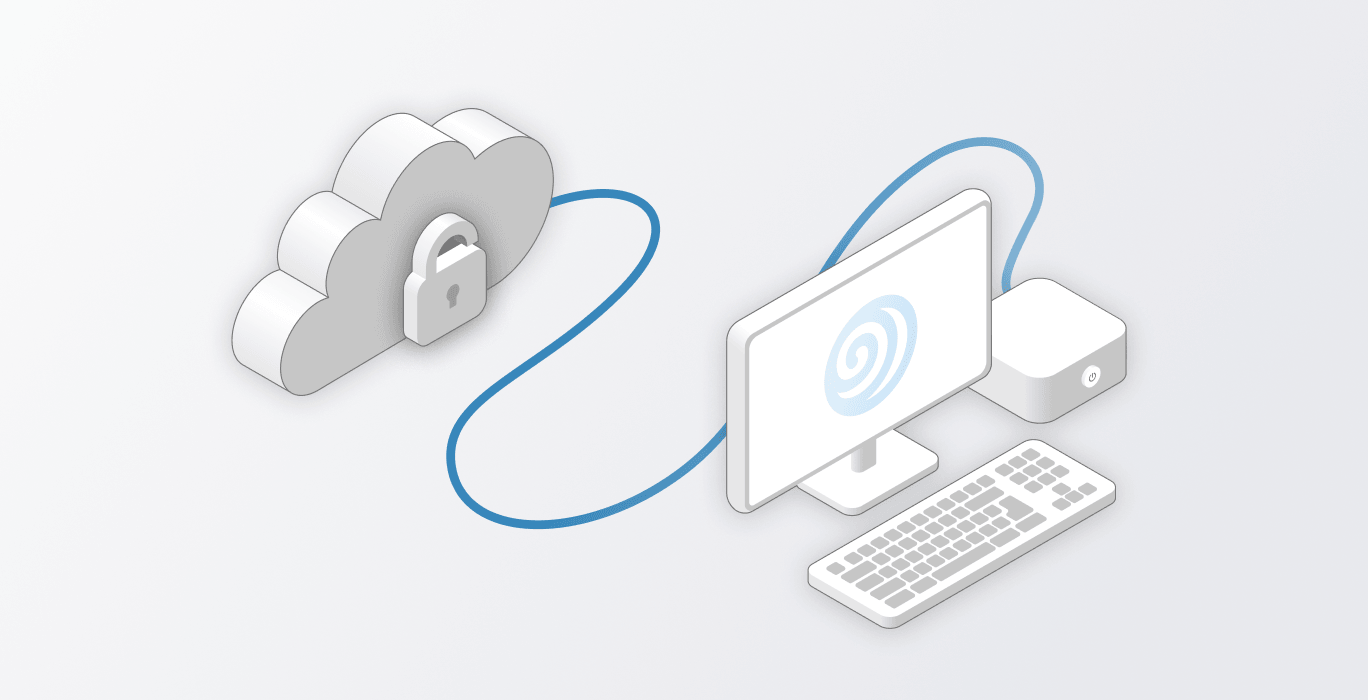
Managed service (SaaS)
Client software connects to servers administered by the provider. Minimal requirements for the customer's IT infrastructure.
Ready to start
We'll show you the platform using your data
We'll load a real archive and show how the system performs over a large interval — from loading to chart rendering.