Goal. Use an end-to-end example to show how to set up an "oil + gas + water" reservoir system correctly in the PVT module, using SiamWellTest as the software.
Audience. Well testing and reservoir engineers setting up a PVT model for the first time. You can use this document as a step-by-step guide and as a template when preparing your own project.
What we do. We work through the module step by step on a hypothetical field:
- Enter the input data: reservoir conditions, oil properties, gas composition, and formation water parameters.
- Calculate fluid properties using the built-in correlations.
- Tune the correlations to laboratory test results.
- Review and analyze the resulting relationships and results.
Study Object
The example is a hypothetical oil field in Western Siberia at a depth of about 2,500 m. The reservoir conditions and fluid properties are set close to those typical of fields in this region.
The hypothetical reservoir contains light oil with dissolved associated gas. Reservoir pressure is well above the bubble point pressure, so at initial conditions the oil is undersaturated and there is no free gas in the reservoir. The pores also contain connate water. Its properties must be taken into account too, so the reservoir system is defined as "oil + gas + water".
Initial Conditions
The reservoir is terrigenous. A connate water saturation of 0.31 (fraction) is typical of sandstones in the region with average porosity and permeability. The rock compressibility is typical of consolidated sandstones. Gas saturation is zero: the oil in the reservoir is undersaturated and there is no free gas phase.
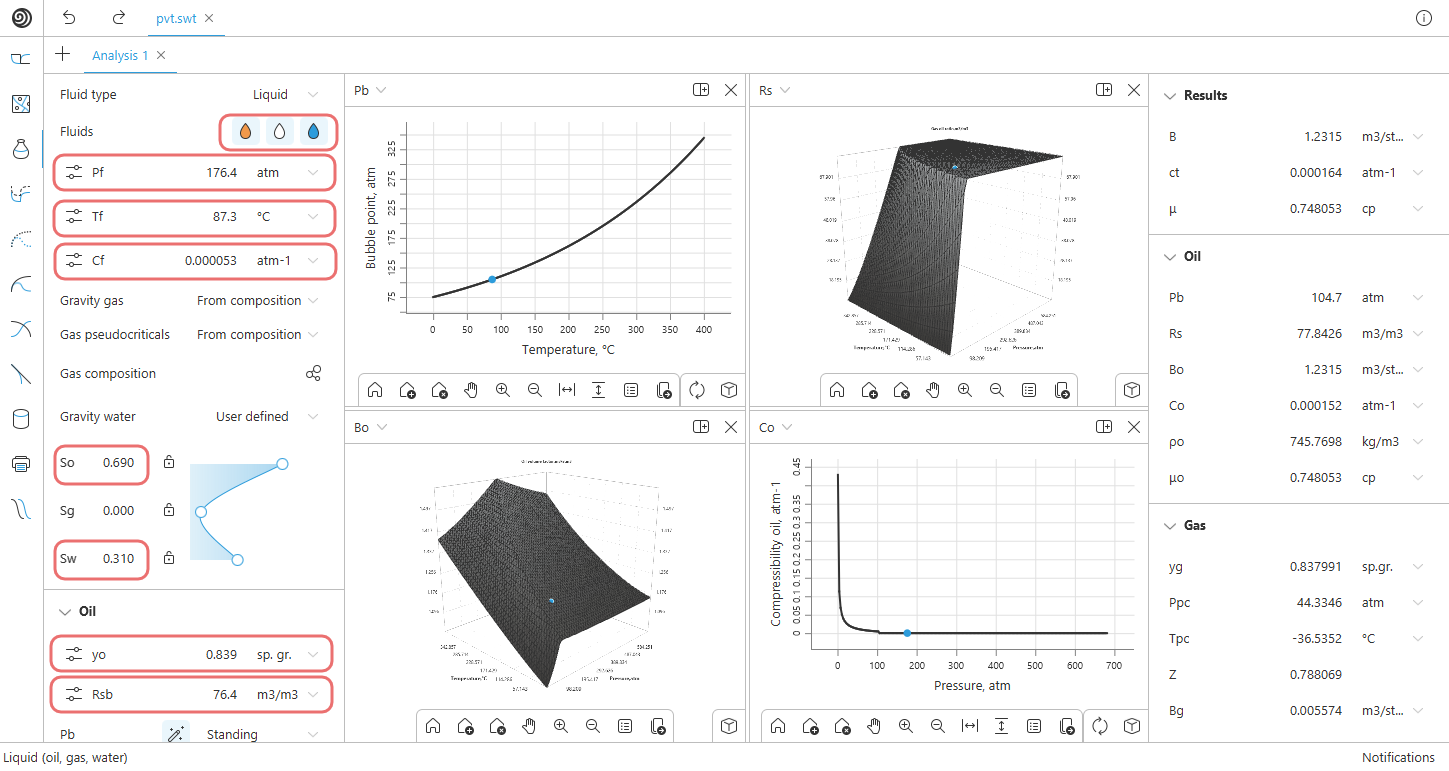
The oil is light (density about 839 kg/m³, ≈ 37 °API) with a moderate solution gas-oil ratio, typical of the region's Jurassic formations. The formation water has low salinity: 21.7 g/L (≈ 21,400 ppm), which corresponds to a water specific gravity of 1.017.
| Parameter | Symbol | Value |
|---|---|---|
| Rock compressibility | Cf | 5.3·10⁻⁵ 1/atm |
| Oil saturation | So | 0.69 fraction |
| Water saturation (connate) | Sw | 0.31 fraction |
| Gas saturation | Sg | 0 |
| Dead oil specific gravity | γo | 0.839 |
| Gas-oil ratio | Rs | 76.4 m³/m³ |
| Formation water salinity | S | 21,400 ppm |
Reference Conditions
The PVT module calculates fluid properties as functions of pressure and temperature. When you need specific values of viscosity, formation volume factor, density, or compressibility, they are taken at a single point on these functions (Fig. 2), defined by the reference pressure and temperature.
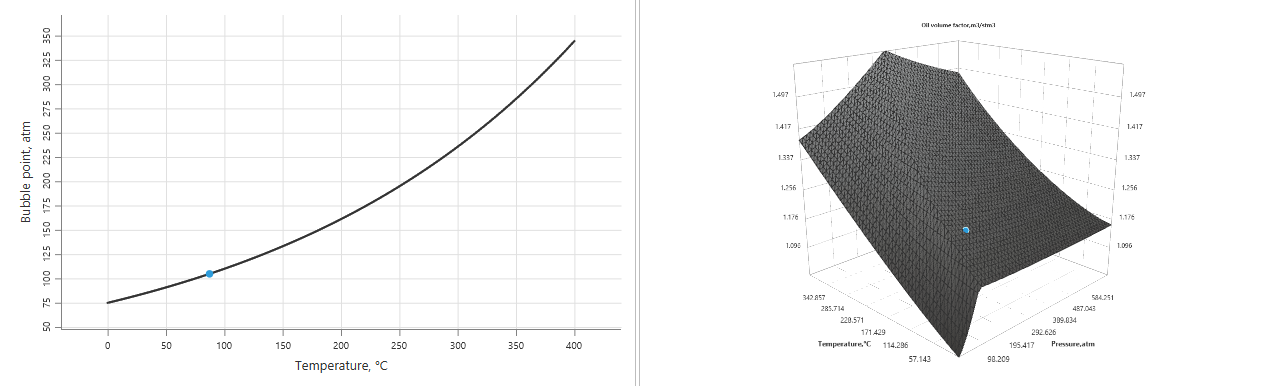
This point determines the final fluid properties, so it is chosen to suit the task at hand. For example, to interpret well tests and run calculations for a producing well, you use the current reservoir pressure in its drainage area. Let us assume that for our work we need the fluid properties at the following state:
| Parameter | Symbol | Value |
|---|---|---|
| Pressure | P | 176.4 atm |
| Temperature | T | 87.3 °C |
Gas Composition
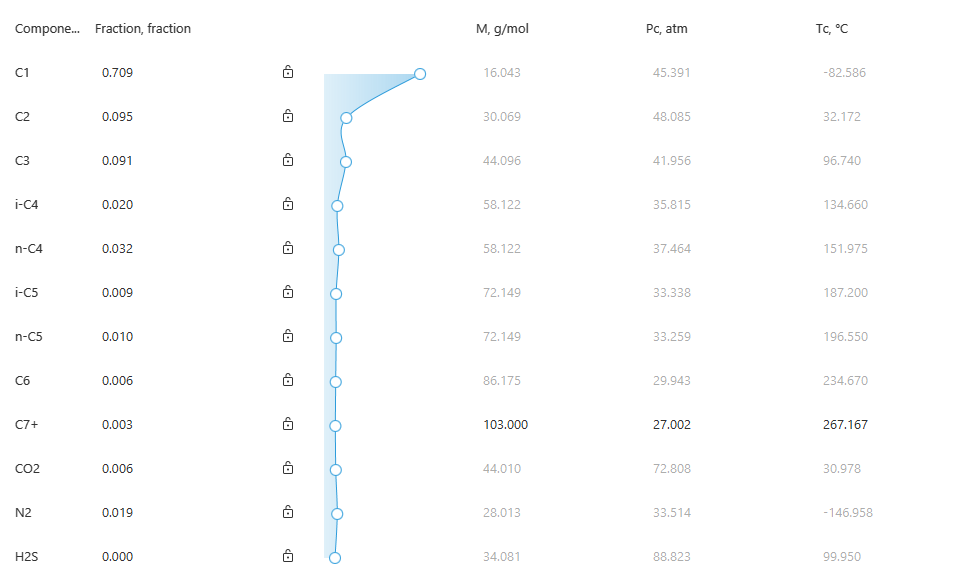
The associated gas is rich: heavy C₃₊ components make up about 17%, which is typical of gases dissolved in light Jurassic oils. The non-hydrocarbon content is low: less than 2% nitrogen, less than 1% carbon dioxide, and no hydrogen sulfide. From the composition, the module calculates the gas specific gravity and its pseudocritical properties, which are then used to calculate the gas phase properties.
| Component | Content, mol % |
|---|---|
| N₂ | 1.87 |
| CO₂ | 0.64 |
| H₂S | 0.00 |
| C₁ | 70.93 |
| C₂ | 9.46 |
| C₃ | 9.12 |
| i-C₄ | 1.95 |
| n-C₄ | 3.21 |
| i-C₅ | 0.94 |
| n-C₅ | 0.97 |
| C₆ | 0.58 |
| C₇₊ | 0.33 |
Gas Pseudocritical Properties
From the entered composition, the module calculates the molar mass of the mixture and the gas specific gravity: γg = 0.838. The pseudocritical properties of the mixture are calculated as mole-fraction-weighted averages of the component critical properties. For comparison, the same properties were calculated with the Sutton and Standing correlations, which estimate pseudocritical properties from gas specific gravity alone.
| Method | Ppc, atm | Tpc, °C |
|---|---|---|
| From gas composition | 44.33 | −36.5 |
| Sutton | 43.7 | −48.3 |
| Standing | 44.3 | −46.4 |
Pseudocritical pressure is practically the same for all methods; the difference does not exceed 1.5%. Pseudocritical temperature from the correlations is 10–12 °C lower than from the composition, which is about a 5% difference on the absolute scale. The reason is that the Sutton and Standing correlations average the properties of many natural gases and account only for specific gravity, not the actual composition. They are therefore used when the composition is unavailable; when the composition is known, calculating from it is preferred. The accuracy of the composition-based calculation depends on how the heavy C₇₊ fraction is characterized, but in this case its share is small (0.33%).
Calculating Properties with Correlations
A correlation is selected in the module for each fluid property. The default base set is used. Properties marked "internal" have no separate correlation: the module calculates them from balance relationships using the values already obtained.
The calculated bubble point pressure is 110.3 atm, well below the reference pressure of 176.4 atm. The oil is undersaturated and all the gas remains dissolved, so the solution gas-oil ratio equals the producing gas-oil ratio. The module calculates gas phase properties at the specified conditions even though there is no free gas in the reservoir. They will be needed when pressure drops below the bubble point.
| Phase | Property | Correlation | Value |
|---|---|---|---|
| Oil | Bubble point pressure Pb | Standing | 110.26 atm |
| Solution gas-oil ratio Rs | Standing | 76.4 m³/m³ | |
| Formation volume factor Bo | Standing | 1.260 m³/m³ | |
| Compressibility Co | Petrosky-Farshad | 1.74·10⁻⁴ 1/atm | |
| Density ρo | internal | 727.5 kg/m³ | |
| Viscosity µo | Beggs-Robinson | 0.659 cP | |
| Gas | Specific gravity γg | from composition | 0.838 |
| Pseudocritical pressure Ppc | from composition | 44.33 atm | |
| Pseudocritical temperature Tpc | from composition | −36.5 °C | |
| Z-factor Z | Dranchuk | 0.788 | |
| Formation volume factor Bg | internal | 5.57·10⁻³ m³/m³ | |
| Compressibility Cg | Dranchuk | 5.19·10⁻³ 1/atm | |
| Density ρg | internal | 184.1 kg/m³ | |
| Viscosity µg | Lee et al. | 0.0212 cP | |
| Water | Formation volume factor Bw | Meehan-Ramey | 1.030 m³/m³ |
| Compressibility Cw | internal | 2.0·10⁻⁵ 1/atm | |
| Density ρw | internal | 986.8 kg/m³ | |
| Viscosity µw | Van Wingen-Frick | 0.353 cP |
Correlation Tuning
The properties calculated in the previous section are only a first approximation. Each correlation is built on a sample of oils and gases from a particular region and reproduces their properties with its own error. For a specific fluid, the deviation can be 10–20% or more, especially for bubble point pressure and viscosity. Therefore, when laboratory data are available, correlations are selected and tuned to the measurements.
Selecting Correlations
The first step is to select the correlation that describes the fluid most closely even before tuning. For this, the fluid properties must fall within the range of data the correlation was built on. The correlations available in the module are briefly described below.
Oil: bubble point pressure, solution gas-oil ratio, formation volume factor
| Correlation | Basis | When to use |
|---|---|---|
| Standing | California oils; 16–64 °API, 38–125 °C | Universal base option for oils with low non-hydrocarbon gas content |
| Vasquez-Beggs | ~6,000 measurements from fields worldwide, separately for oils heavier and lighter than 30 °API | Wide range of properties; a good choice when the oil type is unclear |
| Glaso (non-volatile / volatile) | North Sea oils; 22–48 °API, 27–138 °C | Light and medium oils; the volatile option is for volatile oils with high gas-oil ratio |
| Petrosky-Farshad | Gulf of Mexico oils; 16–45 °API, Pb from ~107 atm | Medium and light oils with high bubble point pressure |
Oil: compressibility
| Correlation | Basis | When to use |
|---|---|---|
| Vasquez-Beggs | Large sample from fields worldwide | Base option for undersaturated oil |
| Petrosky-Farshad | Gulf of Mexico oils | Medium and light oils; consistent with the Pb/Bo correlation of the same name |
Oil: viscosity
| Correlation | Basis | When to use |
|---|---|---|
| Beggs-Robinson | ~2,000 measurements, 16–58 °API | Universal option for dead and live oil |
| Beal | US dead oils | Estimating dead oil viscosity from density and temperature |
| Glaso | North Sea oils | Light and medium oils |
| Andrade | Empirical viscosity-temperature relationship | When viscosity measurements are available to fit the coefficients |
| Petrosky | Gulf of Mexico oils | Medium and light oils, paired with Petrosky-Farshad |
Gas
| Property | Correlation | When to use |
|---|---|---|
| Z | Dranchuk | Fit of the Standing-Katz chart; standard choice for natural gases |
| Dranchuk-Abou Kassem | Refined fit of the Standing-Katz chart, valid over a wider range of reduced pressures; the most widely used option | |
| Hall-Yarborough | Accurate at reduced temperatures above ~1.2; not recommended near the critical point | |
| Standing | Simplified explicit relationship for quick estimates | |
| Cg | Dranchuk | Calculated from the same model as Z |
| µg | Lee et al. | Standard for natural gases without significant H₂S and CO₂ |
Water
| Property | Correlation | When to use |
|---|---|---|
| Bw | Meehan-Ramey | Accounts for pressure, temperature, and salinity |
| µw | Van Wingen-Frick, Helmholtz-Frick | Viscosity-temperature relationships; results are close, the choice is not critical |
The oil in question (≈ 37 °API, 87 °C, gas-oil ratio 76 m³/m³) falls within the ranges of all the default correlations. The bubble point pressure of about 105–110 atm is at the lower bound of the Petrosky-Farshad sample but within it. Therefore, for this case the base set of correlations is kept unchanged, and their mismatch with the actual fluid properties is eliminated at the tuning stage.
Laboratory Data
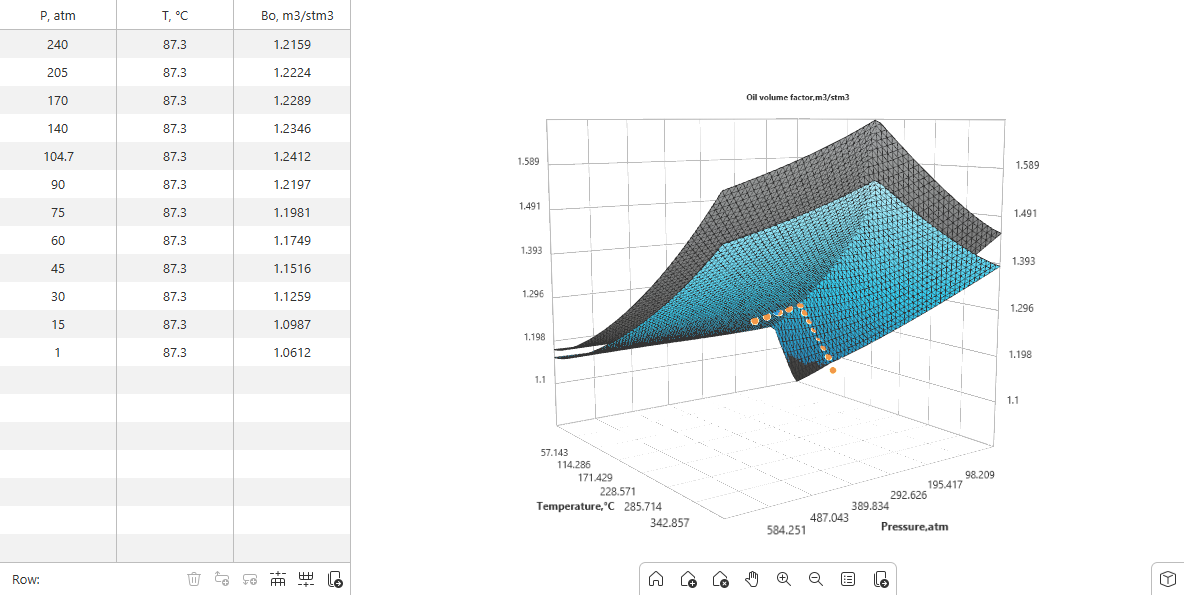
In our case, tuning uses the results of a bottomhole oil sample study at the reservoir temperature of 87.3 °C. Above the bubble point, the formation volume factor and viscosity of single-phase oil were measured; below it, the solution gas-oil ratio, formation volume factor, and oil viscosity were measured as gas came out of solution. Oil compressibility was determined as the average over the pressure interval from the bubble point to 240 atm. The laboratory bubble point pressure was 104.7 atm.
| Parameter | Symbol | Value |
|---|---|---|
| Bubble point pressure | Pb | 104.7 atm |
| Solution gas-oil ratio at Pb | Rs | 76.4 m³/m³ |
| Formation volume factor at Pb | Bob | 1.2412 m³/m³ |
| Oil compressibility (104.7–240 atm) | Co | 1.52·10⁻⁴ 1/atm |
| Oil viscosity at Pb | µob | 0.712 cP |
| Dead oil viscosity at Tres | µod | 2.141 cP |
| P, atm | Rs, m³/m³ | Bo, m³/m³ | µo, cP |
|---|---|---|---|
| 240.0 | 76.4 | 1.2159 | 0.816 |
| 205.0 | 76.4 | 1.2224 | 0.788 |
| 170.0 | 76.4 | 1.2289 | 0.761 |
| 140.0 | 76.4 | 1.2346 | 0.738 |
| 104.7 | 76.4 | 1.2412 | 0.712 |
| 90.0 | 67.3 | 1.2197 | 0.768 |
| 75.0 | 58.0 | 1.1981 | 0.831 |
| 60.0 | 48.4 | 1.1749 | 0.912 |
| 45.0 | 38.3 | 1.1516 | 1.018 |
| 30.0 | 27.6 | 1.1259 | 1.167 |
| 15.0 | 15.9 | 1.0987 | 1.392 |
| 1.0 | 0.0 | 1.0612 | 2.141 |
Measurements are entered into the module as a table: for each point, you specify pressure, temperature, and the property value. The 3D plot shows the laboratory points together with the surfaces before and after tuning, so you can immediately see how far the correlation deviates from the measurements (Fig. 4).
Tuned Properties
Tuning is performed only for oil properties: bubble point pressure and solution gas-oil ratio, formation volume factor, compressibility, and viscosity. Oil is the only mobile phase; its properties enter the calculation directly and make the main contribution to the total system compressibility.
Gas properties are not tuned. At the reference pressure of 176.4 atm the oil is undersaturated, there is no free gas in the reservoir, and the gas phase properties have little effect on the result. In addition, the Z-factor models are based on the generalized Standing-Katz chart, and when the gas composition is known their error usually does not exceed a few percent.
Water properties are not tuned either. The water in the reservoir is connate and immobile, and its contribution to total compressibility does not exceed a few percent. Formation water properties depend only weakly on pressure and are reliably described by correlations based on temperature and salinity, so separate laboratory water studies are usually not performed for such tasks.
Tuning Results
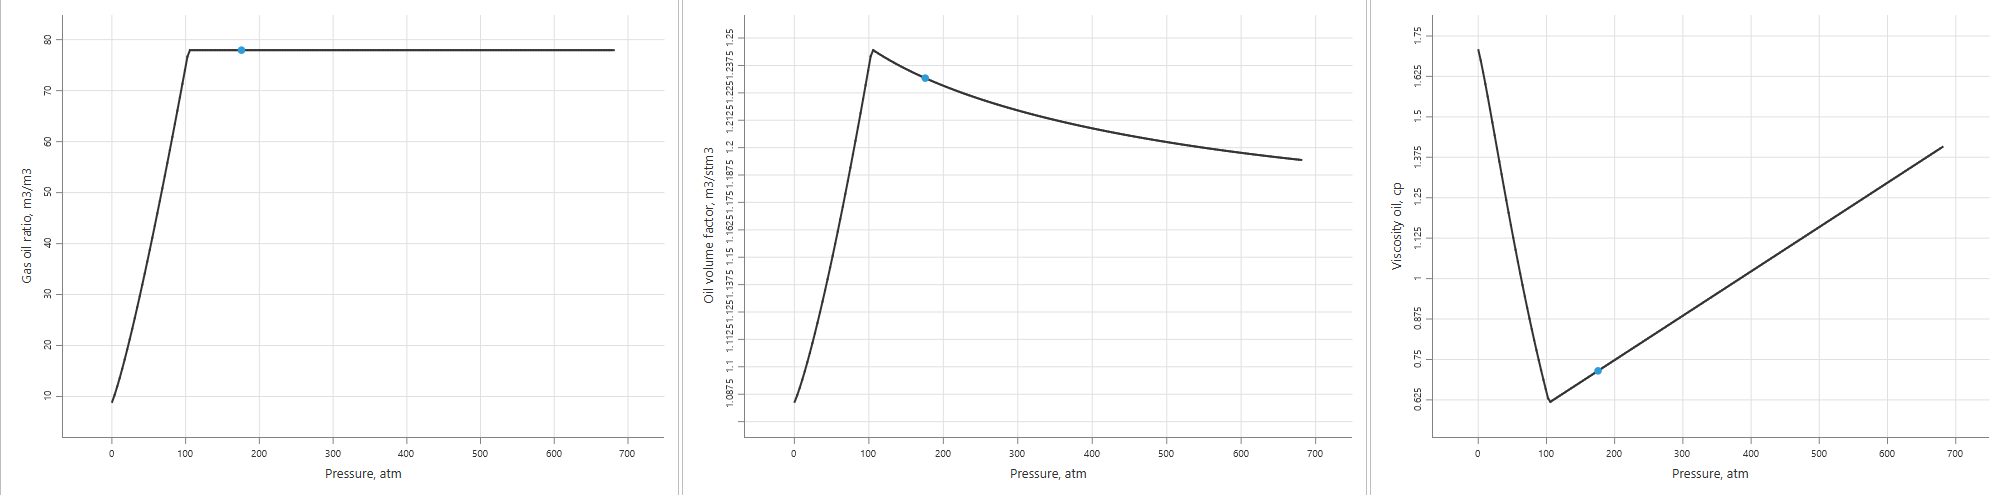
After tuning, the correlations reproduce the laboratory data, and the oil properties at reference conditions (176.4 atm, 87.3 °C) change noticeably. The bubble point pressure matches the measured value, and the compressibility matches the laboratory value. The largest changes are in oil viscosity and compressibility, where the original correlations were off by more than 10%.
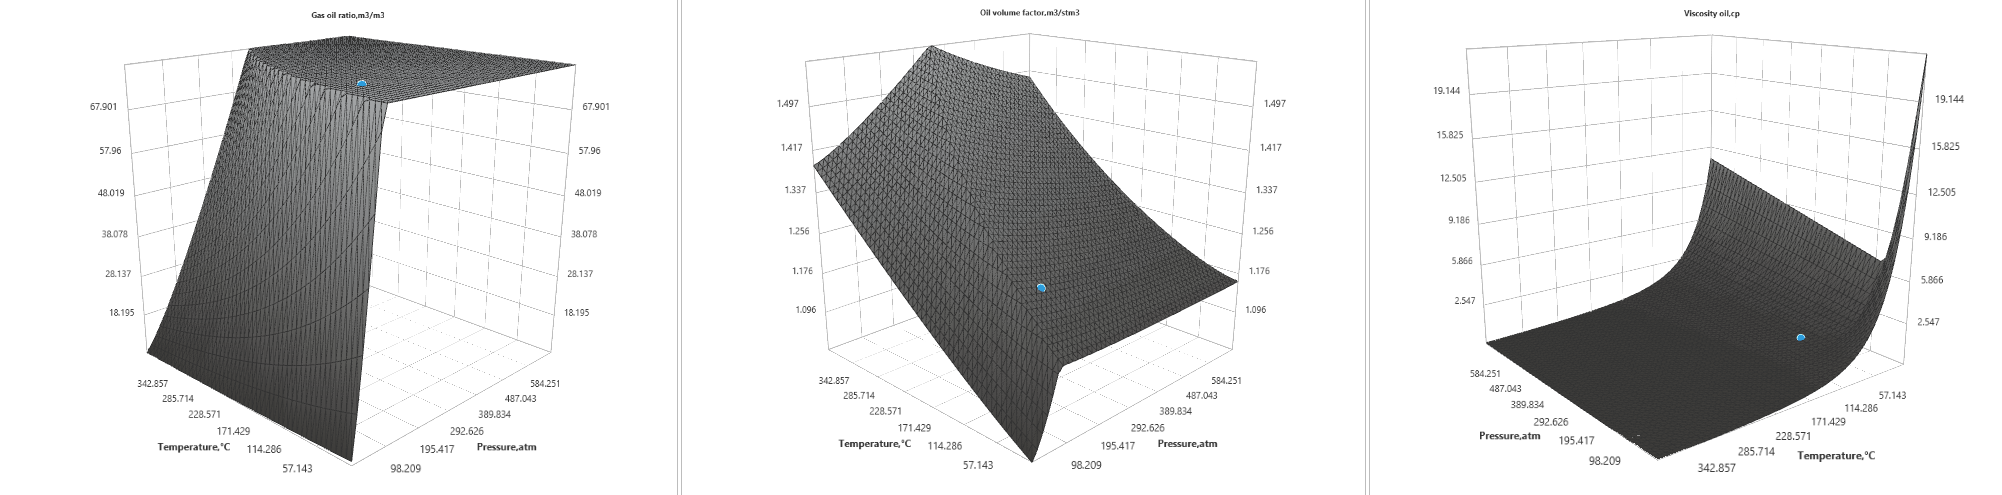
The tuned oil property functions are shown in Fig. 5. The plots at reservoir temperature clearly show the bubble point: above it, the solution gas-oil ratio is constant, the formation volume factor decreases due to oil compression, and viscosity increases. Below the bubble point, as gas comes out of solution, the solution gas-oil ratio and formation volume factor decrease, and oil viscosity increases.
| Property | Before tuning | After tuning | Change |
|---|---|---|---|
| Bubble point pressure Pb | 110.26 atm | 104.70 atm | −5.0% |
| Solution gas-oil ratio Rs | 76.4 m³/m³ | 77.8 m³/m³ | +1.9% |
| Formation volume factor Bo | 1.260 m³/m³ | 1.232 m³/m³ | −2.3% |
| Compressibility Co | 1.74·10⁻⁴ 1/atm | 1.52·10⁻⁴ 1/atm | −12.6% |
| Density ρo | 727.5 kg/m³ | 745.8 kg/m³ | +2.5% |
| Viscosity µo | 0.659 cP | 0.748 cP | +13.5% |
Final System Properties
From the tuned oil properties and the saturations, the module calculates the final properties of the reservoir system. Oil is the mobile phase, so the system formation volume factor and viscosity are the same as for oil. Total compressibility accounts for the contributions of the rock and all fluids in proportion to their saturations.
| Parameter | Before tuning | After tuning | Change |
|---|---|---|---|
| Formation volume factor B | 1.260 m³/m³ | 1.232 m³/m³ | −2.3% |
| Total compressibility ct | 1.79·10⁻⁴ 1/atm | 1.64·10⁻⁴ 1/atm | −8.4% |
| Viscosity µ | 0.659 cP | 0.748 cP | +13.5% |
Impact of PVT Properties on Well Test Interpretation Results
To assess the practical value of tuning, let us compare how the interpretation results of the same test change with different sources of fluid properties. In practice, the formation volume factor, viscosity, and total compressibility are often taken without a PVT model: from a laboratory report at initial reservoir pressure, from the well's operating parameters, or from untuned correlations.
| Case | Source | B, m³/m³ | µ, cP | ct, 1/atm |
|---|---|---|---|---|
| Reference | Tuned PVT model | 1.232 | 0.748 | 1.64·10⁻⁴ |
| 1 | Correlations without tuning | 1.260 | 0.659 | 1.79·10⁻⁴ |
| 2 | Laboratory report | 1.216 | 0.816 | 1.64·10⁻⁴ |
| 3 | Well operating parameters | 1.274 | 0.630 | 1.30·10⁻⁴ |
In case 2 the properties are correct but taken at initial reservoir pressure rather than current pressure. In case 3 the formation volume factor and viscosity are field averages from the development design documents, and total compressibility is a typical value.
For the same pressure measurements, the interpretation results depend on fluid properties as follows:
- permeability is proportional to the product of viscosity and formation volume factor: $k \sim \mu B$;
- the wellbore storage coefficient is proportional to the formation volume factor: $C \sim B$;
- the radius of investigation and distance to boundaries are proportional to $\sqrt{B / c_t}$;
| Parameter | Case 1 | Case 2 | Case 3 |
|---|---|---|---|
| Permeability k | −9.8% | +7.7% | −12.9% |
| Wellbore storage coefficient C | +2.3% | −1.3% | +3.5% |
| Radius of investigation, distance to boundaries | −3.2% | −0.6% | +14.2% |
Permeability depends most strongly on PVT properties. Errors in viscosity and formation volume factor do not cancel each other out but accumulate, and in all three cases the deviation is 8–13%. Even correct laboratory data taken at the wrong pressure give an error of about 8%: the viscosity of undersaturated oil increases noticeably with pressure. The error in total compressibility mainly affects geometry: with the typical compressibility from case 3, distances to boundaries are overestimated by 14%. The skin factor is insensitive to PVT properties, so we do not compare it separately.
The example considered here is a favorable one: the oil is light, low-viscosity, and undersaturated. For viscous oils and at pressures close to the bubble point, fluid properties depend more strongly on pressure and composition. There, skipping the PVT model leads to errors of tens or hundreds of percent, which carry over into the parameters determined from well tests.
Conclusion
Using a hypothetical field, we showed how to build an "oil + gas + water" reservoir system model in the SiamWellTest PVT module, calculate fluid properties, and refine them using laboratory data.
Key takeaways:
- PVT is the foundation of quantitative interpretation. Reservoir parameters determined from well tests depend heavily on fluid properties. If the properties are approximate, the interpretation results carry a corresponding error.
- Correlations are convenient but approximate. The built-in correlations let you quickly estimate fluid properties even with limited data, but for a specific fluid they remain an approximation.
- Laboratory data are worth using. Tuning the correlations to measurements makes the model consistent with the actual fluid across the entire pressure range. As a result, instead of generalized correlations or individual laboratory points, you use a complete fluid model for the specific field.
- Low barrier to entry. Accounting for all the property relationships of a multiphase fluid requires a large amount of calculation, but SiamWellTest handles it. The user only needs to provide the input data: basic reservoir and fluid properties and laboratory test results.
As a result, the engineer gets a consistent set of fluid properties that can be recalculated for any required conditions and used in further analysis.